Identify Entry and Exit Points
Part 3: Knowing When to Enter and Exit Trades
The third part of the system focuses on identifying the best points to enter and exit trades. However, before we can determine those entry and exit points, we need to understand the key levels in the market. These levels are crucial, and most traders don’t fully grasp their significance.
The Importance of Key Levels in the Market
These key levels are directly related to the activities of banks.
How Banks Operate:
- Every bank holds a reserve billions of dollars—within central banks at any given time.
- As I previously explained, Company A from Country B might want to exchange currency with Company X in Country Z. Banks handle these transactions by pulling from their reserves.
Once the transaction is complete, banks still need to make money. To do this, they may raise or lower interest rates, manipulating the market to push it toward the levels where they can inject billions into the market and profit.
Bank Manipulation and Market Behavior
Before banks make their move, they often manipulate the market at these key levels by driving it in the opposite direction. Most traders don’t understand this, which is why they end up on the losing side.
The Solution: My Secret Indicator
This is where my secret weapon comes into play this indicator specifically designed to keep me out of the market when banks are conducting their manipulations.
Unlike other traders who rely on complex strategies like trendlines, Fibonacci retracements, candlestick patterns, and pivot points, I don’t need all that. Instead, I simply wait for the banks to finish their moves, then I enter the market alongside them to make profits.
The Power of My Indicator
This indicator uses price action data from the last 1,440 candles to calculate entry and exit points. It also analyzes years of price data to plot key levels on the chart.
With this tool, you don’t need to worry about understanding highs, lows, Fibonacci, pivots, or trendlines. You only need to know when to enter and exit. That’s it. Trading doesn’t get any simpler than this.
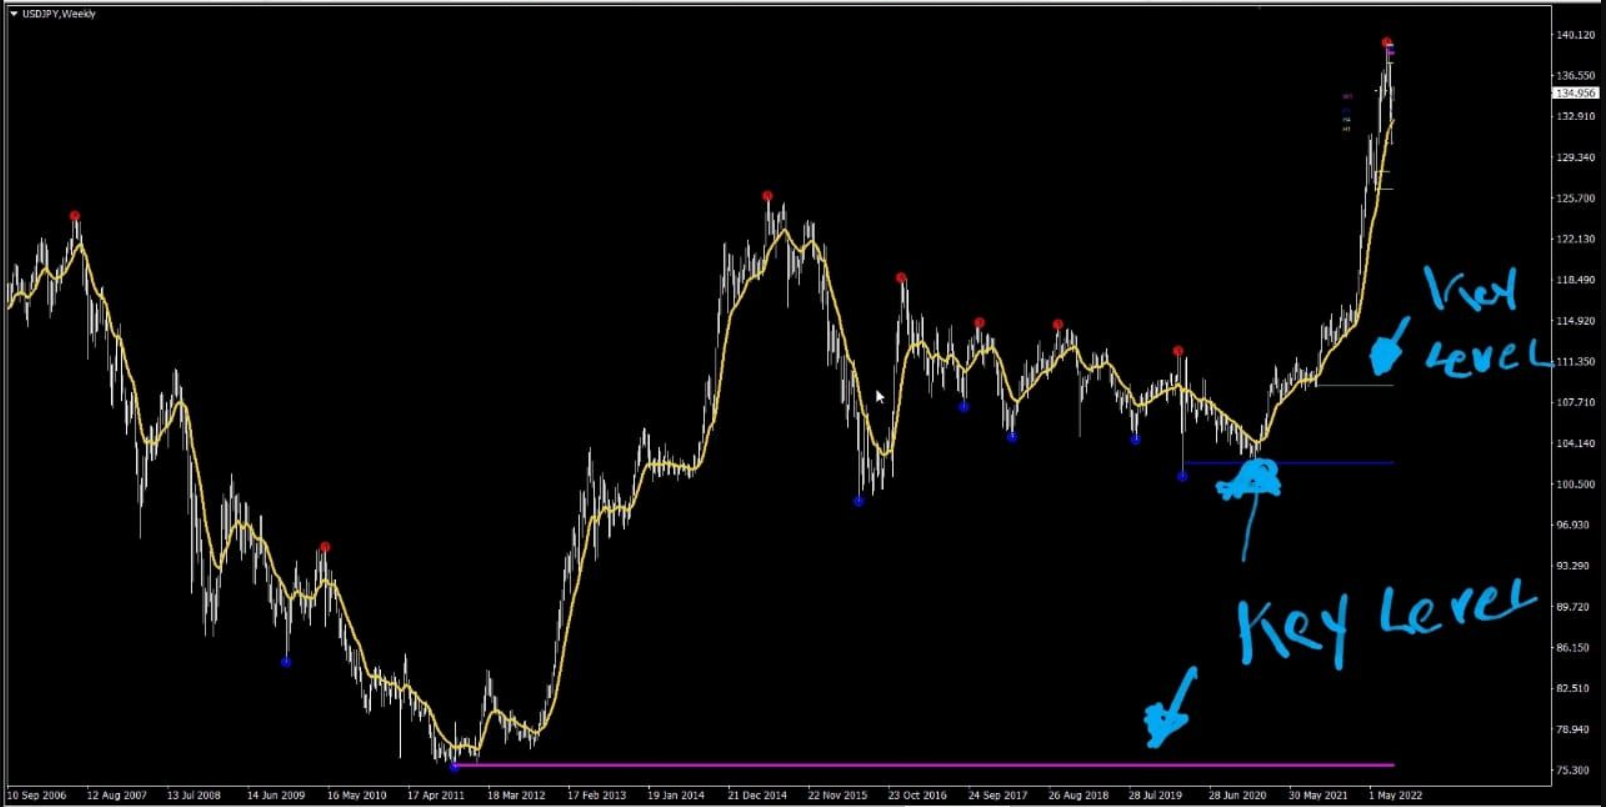
Example: USD/JPY Weekly Chart

Let me show you how this works with the USD/JPY:
- The banks may have a target level to reach, but it might take 2 to 5 years for them to get there. I don’t have the luxury to wait that long i need to make money now.
To do this, I use at least 1 day’s worth of price action data to capitalize on market moves in the meantime.
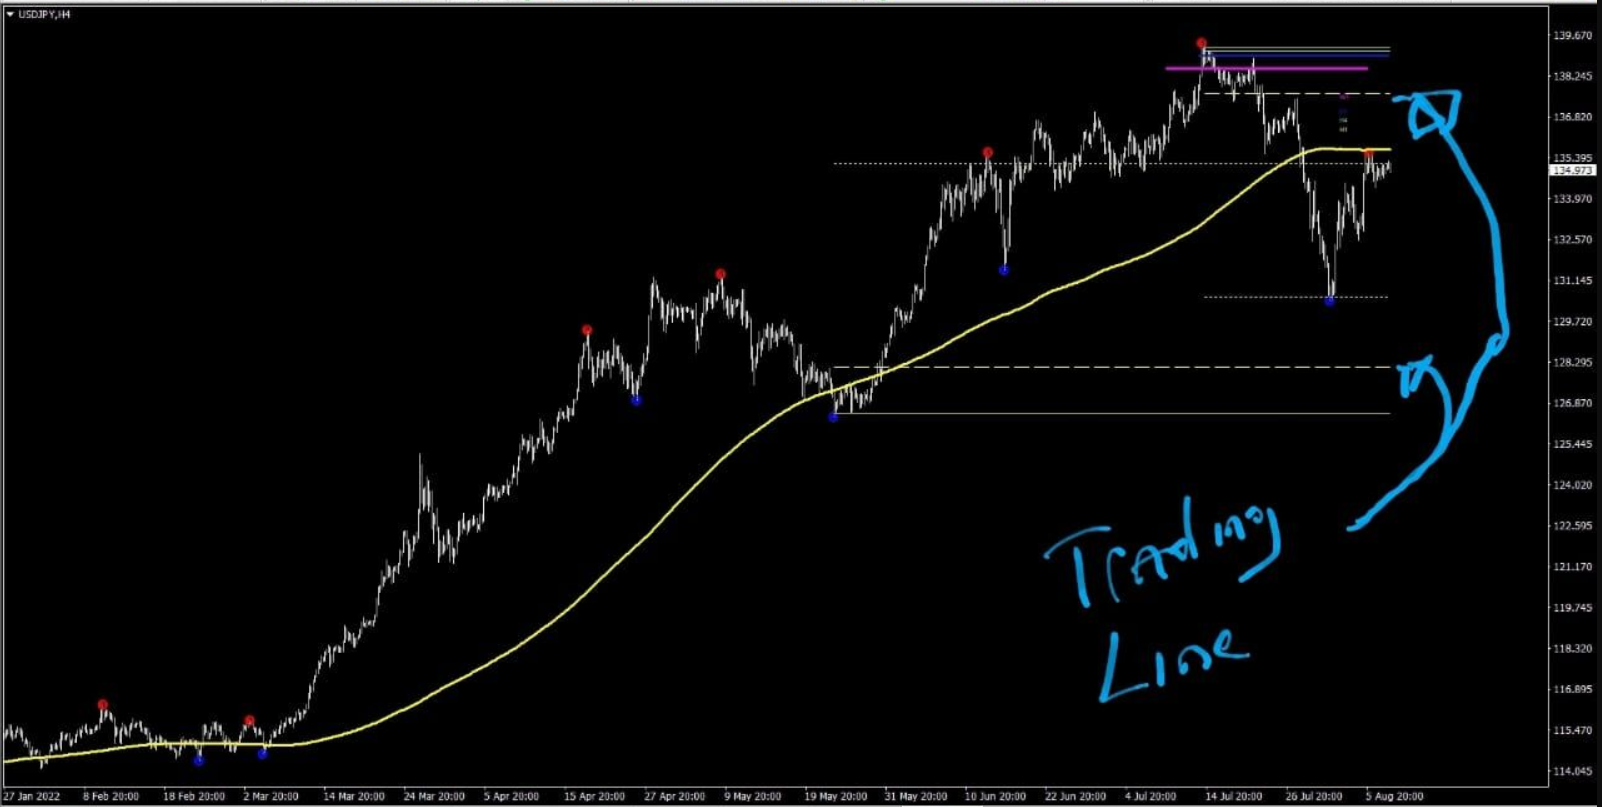
Example: USD/JPY 4-Hour Chart
On the chart below, you’ll notice several lines. These lines indicate the key levels where I should either stay out of the market or enter trades.

- If the price is between the two lines at the bottom of the chart, I stay out of the market.
- Once the price moves above these lines, I simply enter a sell/buy trade and hold it until it reaches the next level below/above.
Let the Indicator Do the Work
This indicator automates the thinking process for me, doing the work I’d otherwise have to perform manually. It identifies where to enter, when to exit, and how to follow the banks’ moves.
A Final Thought
I’ve invested significant time and money into acquiring this tool, and giving it away for free would be a tough decision. However, I’m willing to work something out. For now, let’s continue with the training and get you up to speed on this powerful system.